Data in Motion.
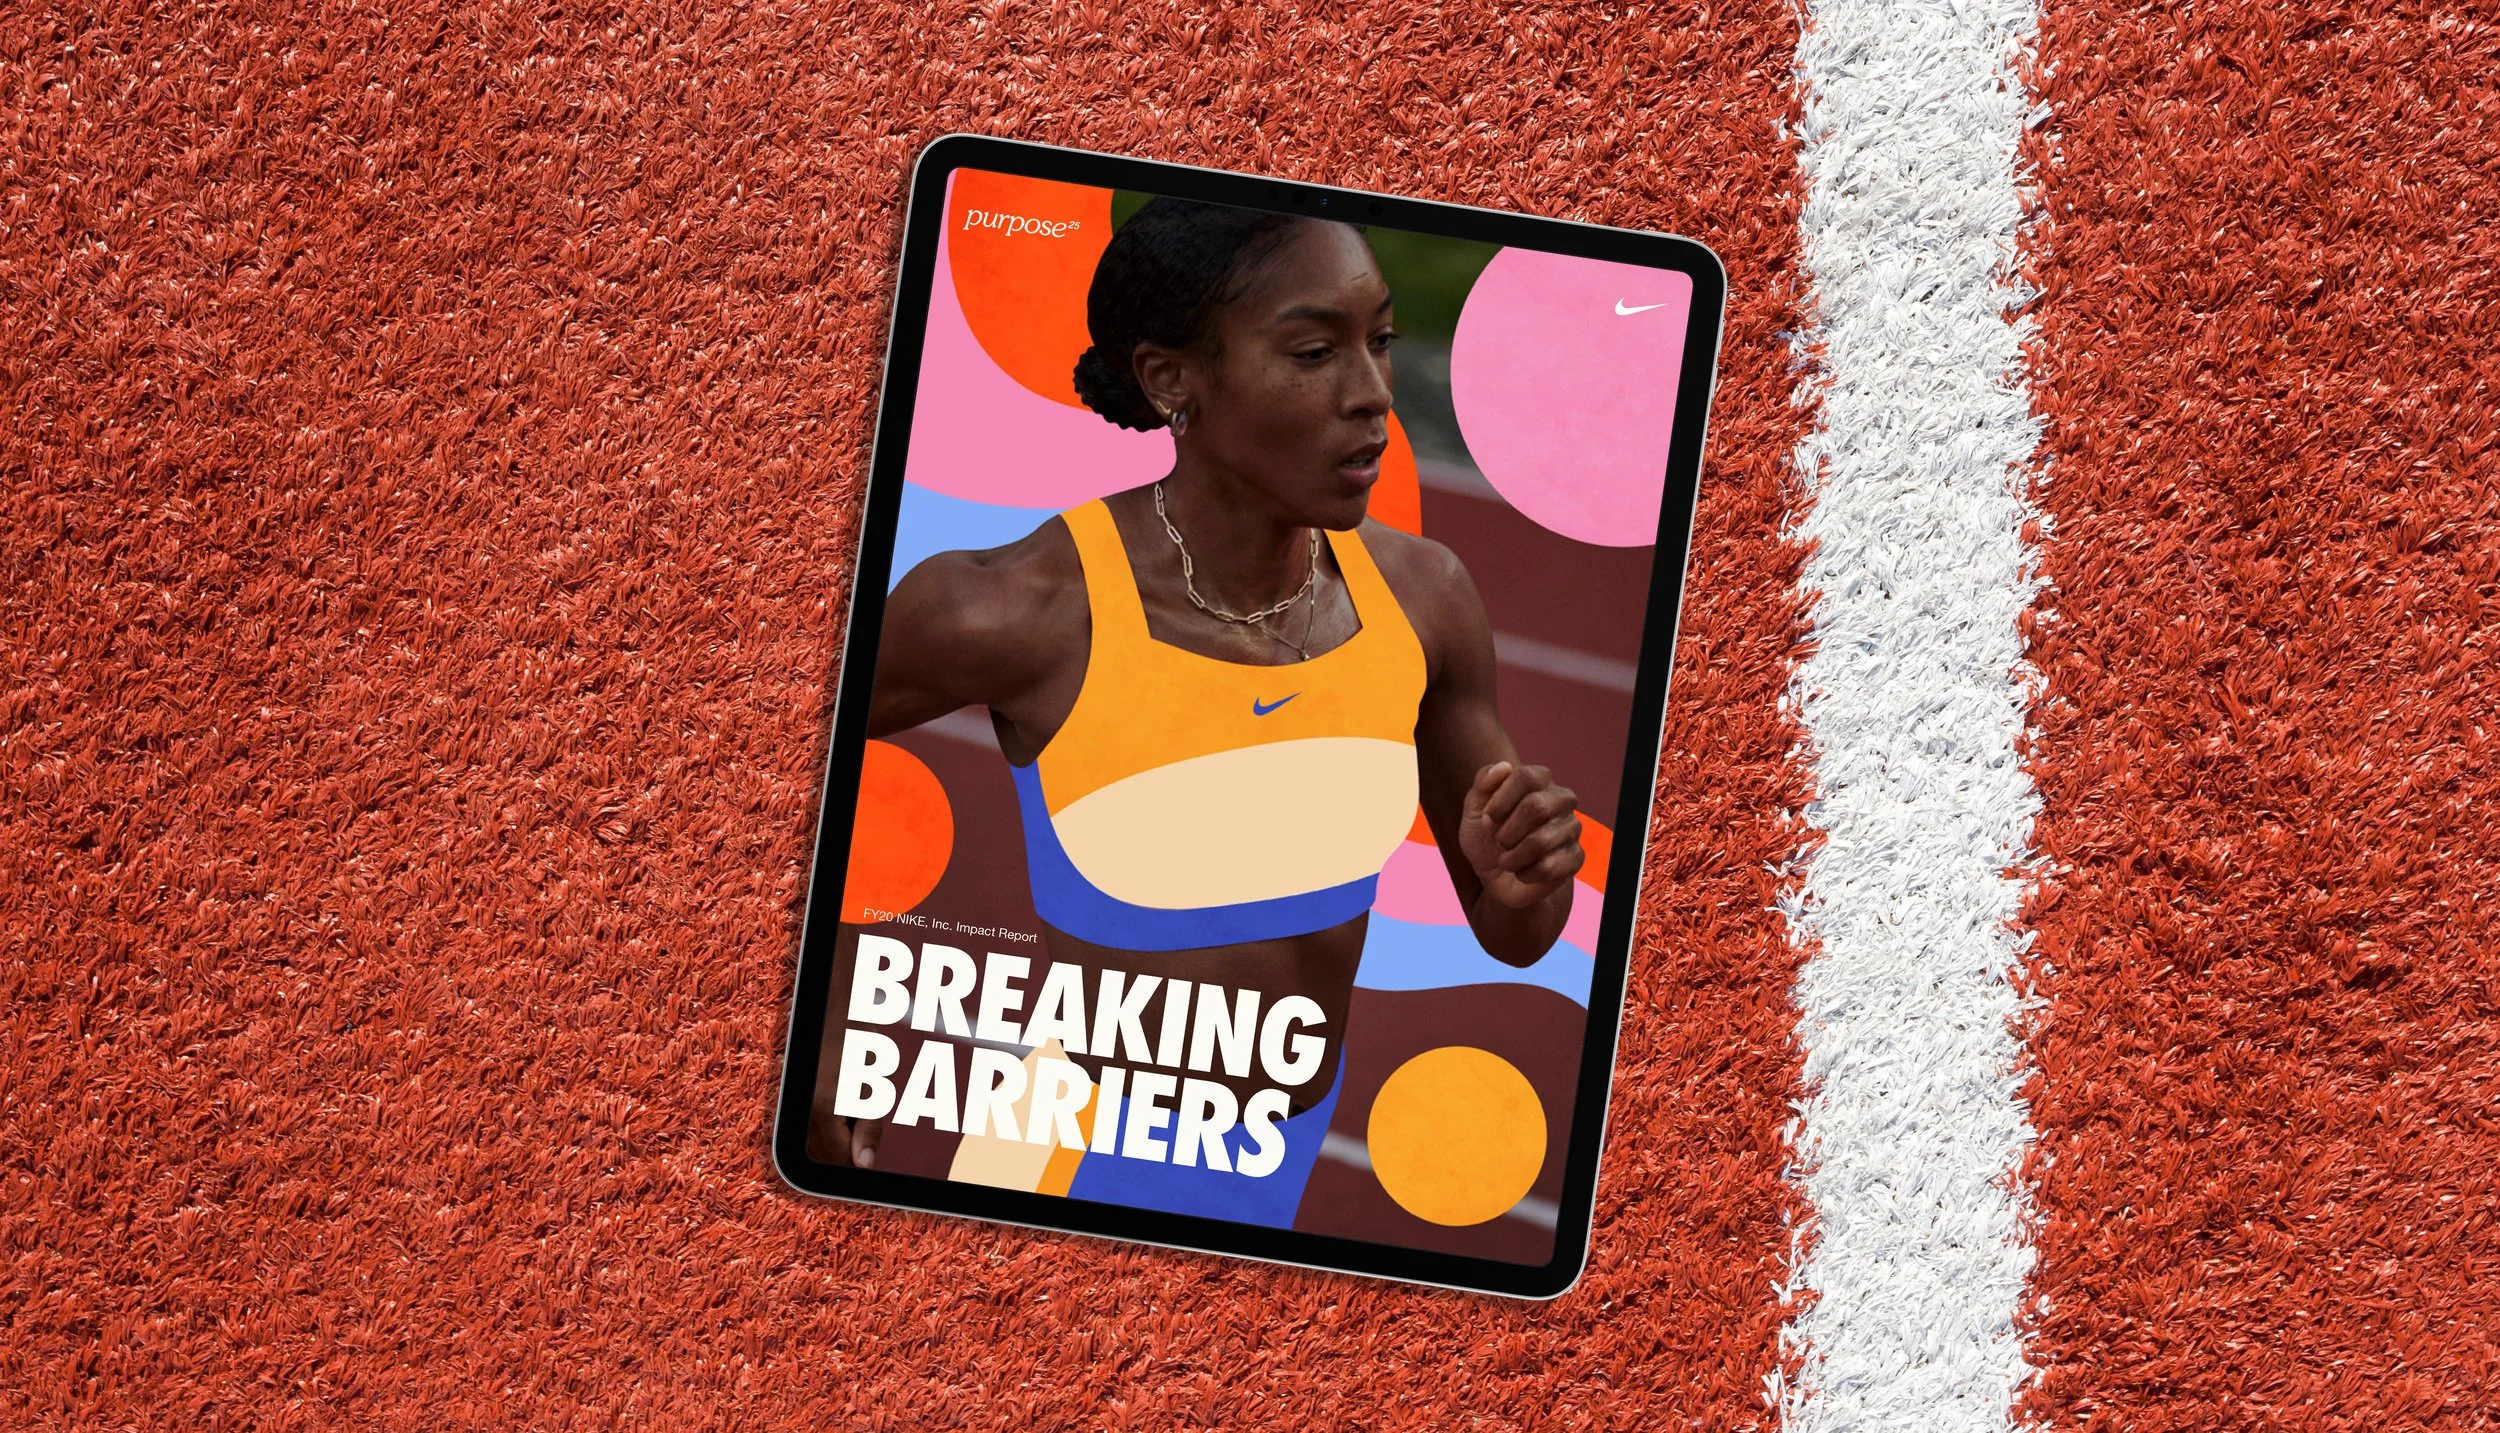
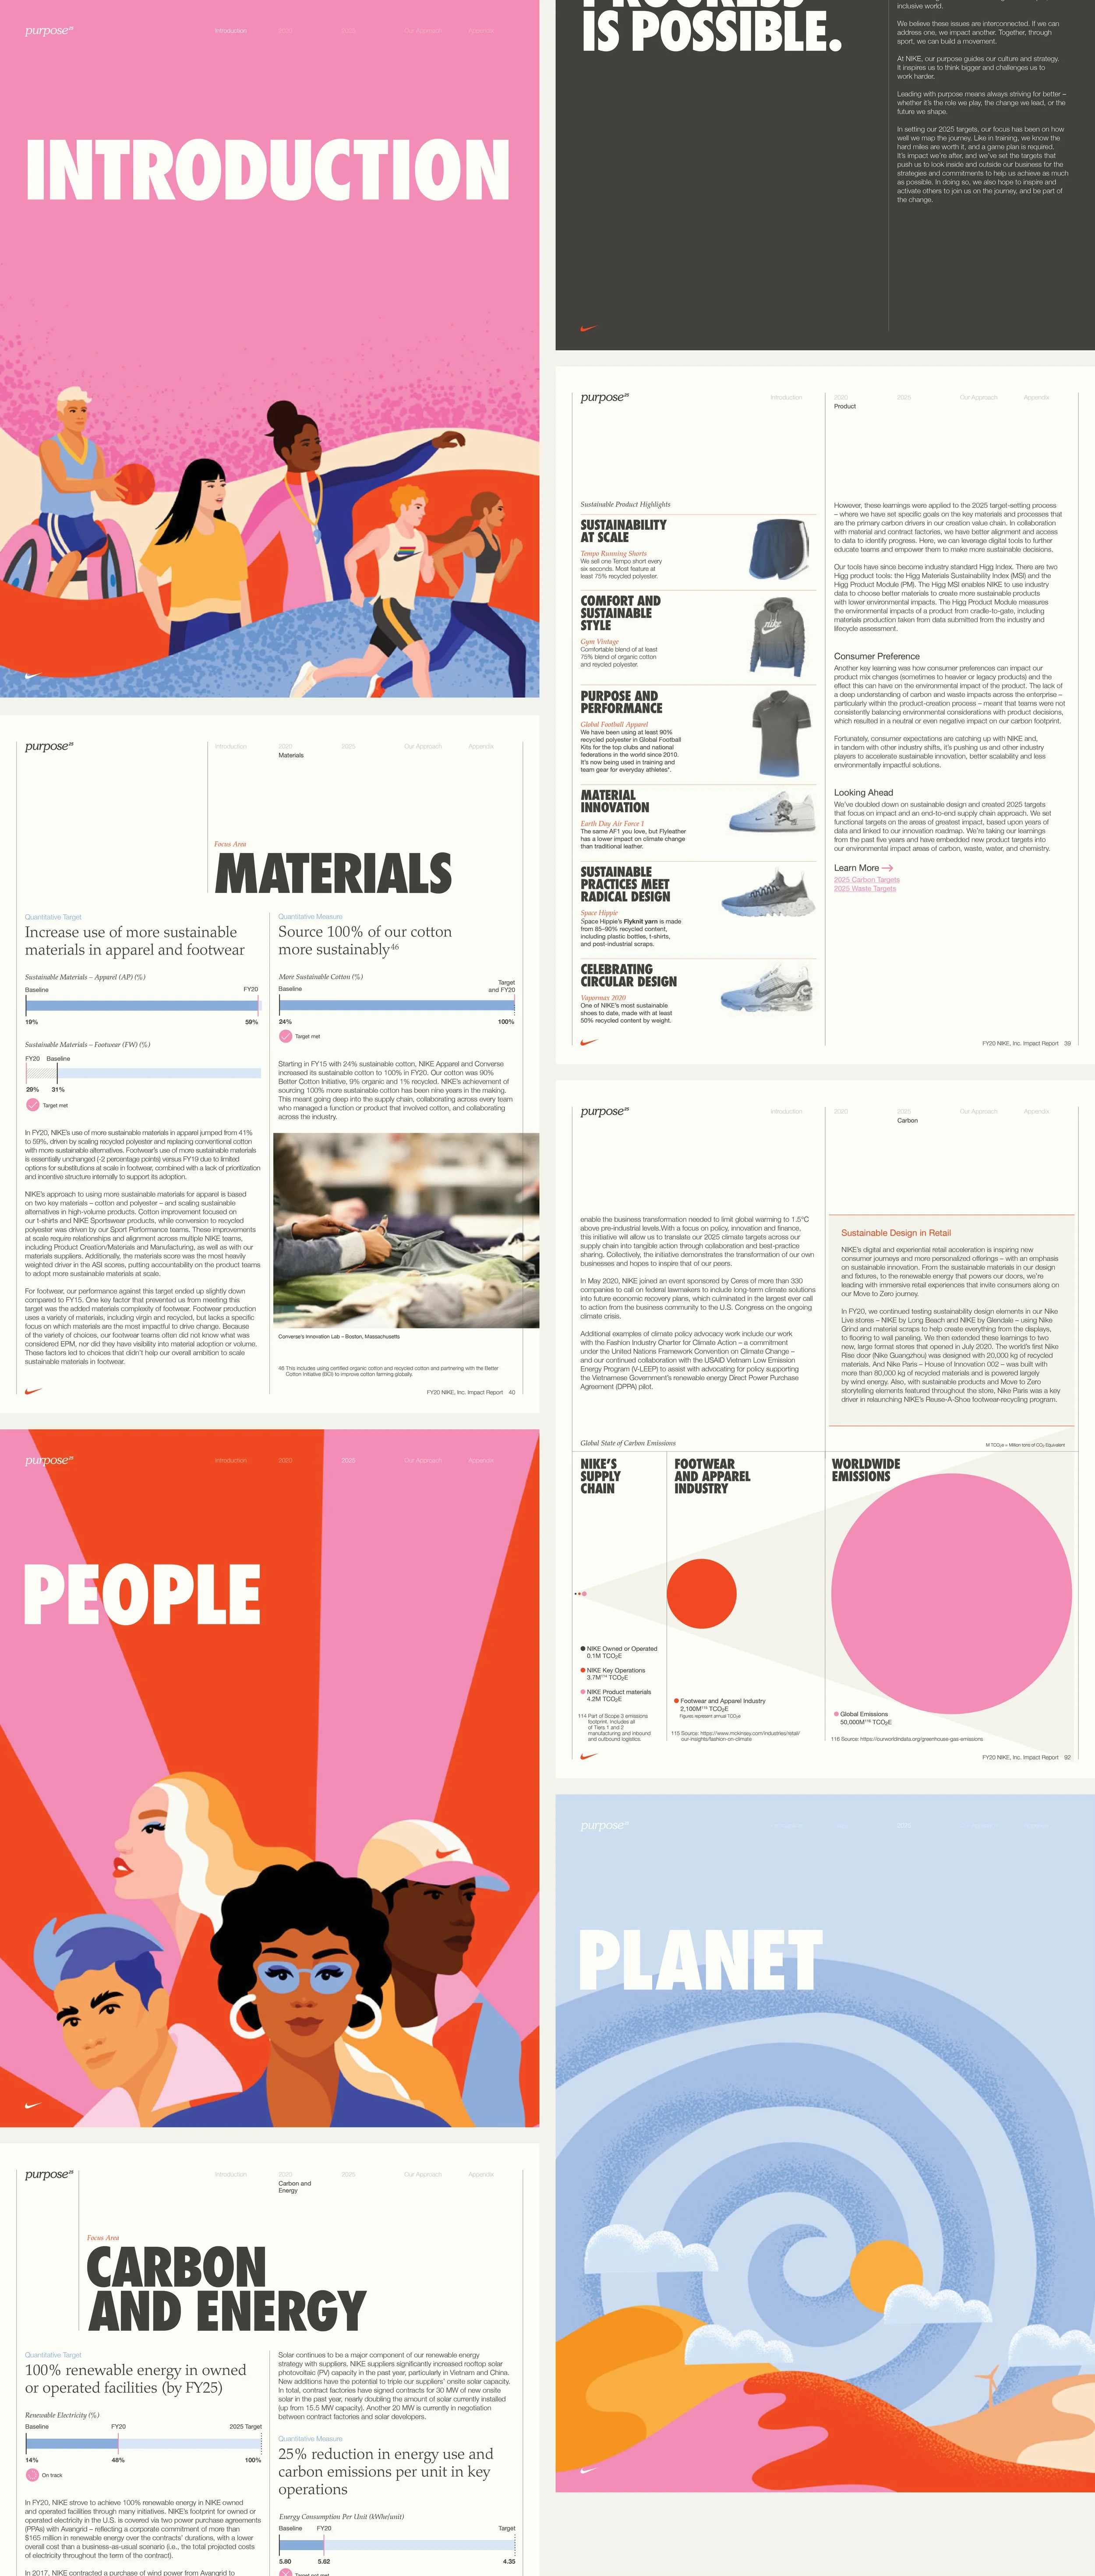
Nike’s story was carried through bold data visualisation. Vast amounts of information were distilled into digestible, energetic graphics that became a core design language for the report. The result was a dynamic and accessible publication that felt unmistakably Nike.
Design
Client-Facing
Data visualisation


Data Visualisation.

